This Design Tip continues our series on how to implement common dimensional design patterns in your ETL system. The relationship between a fact table and its dimensions is usually many-to-one. That is, one row in a dimension, such as customer, can have many rows in the fact table, but one row in the fact table should belong to only one customer. However, there are times when a fact table row can be associated with more than one value in a dimension. We use a bridge table to capture this many-to-many relationship.
There are two major classes of bridge tables. The first, and easiest to model, captures a simple set of values associated with a single fact row. For example, an emergency room admittance record may have one or more initial disease diagnoses associated with it. There is no time variance in this bridge table because it captures the set of values that were in effect when the transaction occurred.
The second kind of many-to-many relationship exists independent of the transactions being measured. The relationship between Customer and Account is a good example. A customer can have one or more accounts, and an account can belong to one or more customers, and this relationship can vary over time.
This Design Tip covers the steps to create a simple static bridge table; this approach can be extended to support the more complex time-variant bridge table.
Historical Load
The steps involved in creating the historical bridge table depend on how the data is captured in the source system. Our assumption is the source captures data that associates the multivalued set of dimension IDs with each transaction ID. In the diagnosis example, this would be a table with one row for each admission record transaction ID and diagnosis ID. Note that this table will have more rows than the number of individual admission transactions.
Create the Initial List of Groups
Since the source is normalized and has one row per dimension value, the first step is to create a unique list of the groups of diagnoses that occur in the transaction table. This involves grouping the sets of diagnoses together, de-duplicating the list of groups, and assigning a unique key to each group. This is often easiest to do in SQL by creating a new table to hold the list of groups. Using the diagnosis example, Figure 1 shows how the first few rows from the transaction system might be grouped and de-duplicated into the Diagnosis Group table.
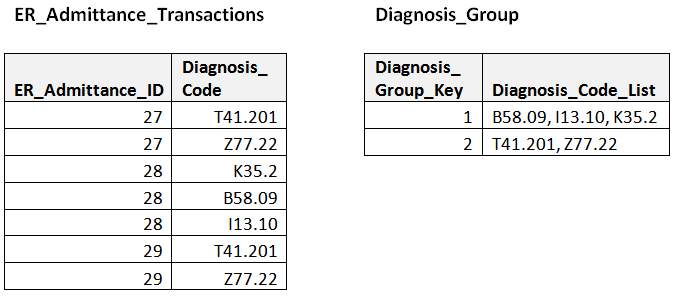
Figure 1 –Source transaction data and associated diagnosis group table.
There are many ways to do this in the various dialects of SQL. The following version uses a string aggregation approach based on SQL Server T-SQL, using the STUFF() string function to do the concatenation, the FOR XML PATH to collapse the rows into each transaction’s set of codes, the SELECT DISTINCT to create the unique list of groups, and the Row_Number() function to assign the group key.
SELECT Row_Number() OVER ( ORDER BY Diagnosis_Code_List) AS
Diagnosis_Group_Key, Diagnosis_Code_List
INTO Diagnosis_Group
FROM(
SELECT DISTINCT Diagnosis_Code_List
FROM
(SELECT DISTINCT OuterTrans.ER_Admittance_ID,
STUFF((SELECT ‘, ‘ + CAST(Diagnosis_Code AS VARCHAR(1024))
FROM ER_Admittance_Transactions InnerTrans
WHERE InnerTrans.ER_Admittance_ID = OuterTrans.ER_Admittance_ID
ORDER BY InnerTrans.Diagnosis_Code
FOR XML PATH(”)),1,2,”) AS Diagnosis_Code_List
FROM ER_Admittance_Transactions OuterTrans
) OuterList
) FinalList;
Make sure your version of this code keeps the group lists in consistent order; in some cases the group ‘T41.201, Z77.22’ is the same as the group ‘Z77.22, T41.20’. In health care, the order is often important and both groups would be created; the source system must provide a sequence number which would be included in the inner sort order and passed through to the bridge table. Note that the Diagnosis Group table is much shorter than the original source data. This is partly because we’ve flattened the row set, but also because the number of combinations of values used in real life is often much smaller than the theoretically possible combinations.
Create the Bridge Table
Once we’ve done the work to create the Diagnosis Group table and assign the group keys, we need to unpivot it to create the actual Diagnosis Bridge table. This is the table that maps each group to the individual dimension rows from which it is defined. Figure 2 shows the Diagnosis Bridge table and the associated ICD10_Diagnosis dimension table based on our example data.
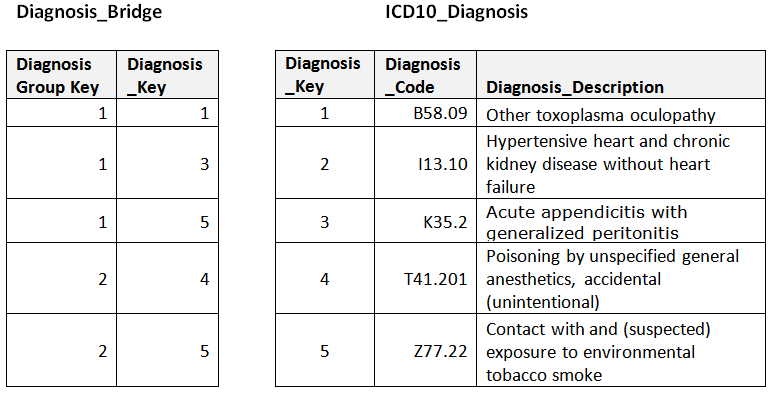
Figure 2 –Diagnosis Bridge table and associated ICD10_Diagnosis dimension.
Again, there are many ways to accomplish this in SQL. The following version in SQL Server T-SQL uses a two-step process to unpivot the group table. The first step concatenates XML tags (<I> </I>) into the Diagnosis_Code_List and converts it to an XML datatype as part of a common table expression. The second step uses the CROSS APPLY command to parse out the XML tags and list the values on separate lines.
WITH XMLTaggedList AS (
SELECT Diagnosis_Group_Key,
CAST(‘<I>’ + REPLACE(Diagnosis_Code_List, ‘, ‘, ‘</I><I>’) + ‘</I>’ AS XML)
AS Diagnosis_Code_List
FROM Diagnosis_Group
)
SELECT Diagnosis_Group_Key,
ExtractedDiagnosisList.X.value(‘.’, ‘VARCHAR(MAX)’) AS Diagnosis_Code_List
FROM XMLTaggedList
CROSS APPLY Diagnosis_Code_List.nodes(‘//I’) AS ExtractedDiagnosisList(X);
Incremental Processing
The incremental load process applies essentially the same code to the incoming fact rows. The first step generates a Diagnosis_Code_List column for each group of incoming fact rows at the grain of the fact table. This Diagnosis_Code_List value can then be used to join to the Diagnosis_Group table to map incoming fact rows to the appropriate group key. If a new group shows up, the ETL process will need to add it the Diagnosis_Group table, just like it does for mini-dimensions and junk dimensions.
We’ve used SQL to illustrate the design pattern used in creating a bridge table. The same logic could be implemented in the native syntax and control structures of most ETL tools. Of course, if would be ideal if the ETL tool developers built bridge table processing into their toolset rather than forcing us all to reinvent the wheel. Maybe they’ll put it in the next release. If you’d like the SQL script for this example, send me a note.
NOTE: This Design Tip has been updated from the original to include a surrogate key on the ICD10_Diagnosis table.